Welcome to the new dashboard for the Civic Information Index. In this updated version, the county-level map and indicator dashboard are now combined in one seamless interface. Just click on a county or search for one in the new search bar to see how it performed. Then click on the gray arrow next to each data point to learn more about where the data comes from, or click “Compare” beneath the search bar to compare two counties. You can also now download the dataset that drives the Index below.
Understanding and contextualizing Index scores
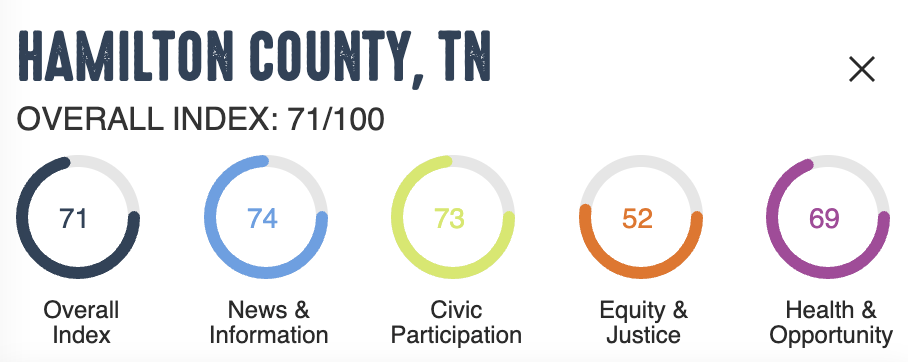
To investigate and contextualize local outcomes, users can start with the overall Index score, which is shown in comparison to all other counties in the U.S. For example, Hamilton County in Tennessee has an overall Index score of 71, indicating the county performs better than 71 percent of counties in the nation.
A look at the scores for each pillar shows a higher performance on the news and information measures (74), and the lowest performance on equity and justice measures (52). Does this mean there may be equity challenges in this county? And what are the county’s information ecosystem strengths that local efforts can build on?
Index results for Hamilton County, Tennessee

Exploring the indicators for each pillar in detail provides some insights on these and other questions that emerge from the data.
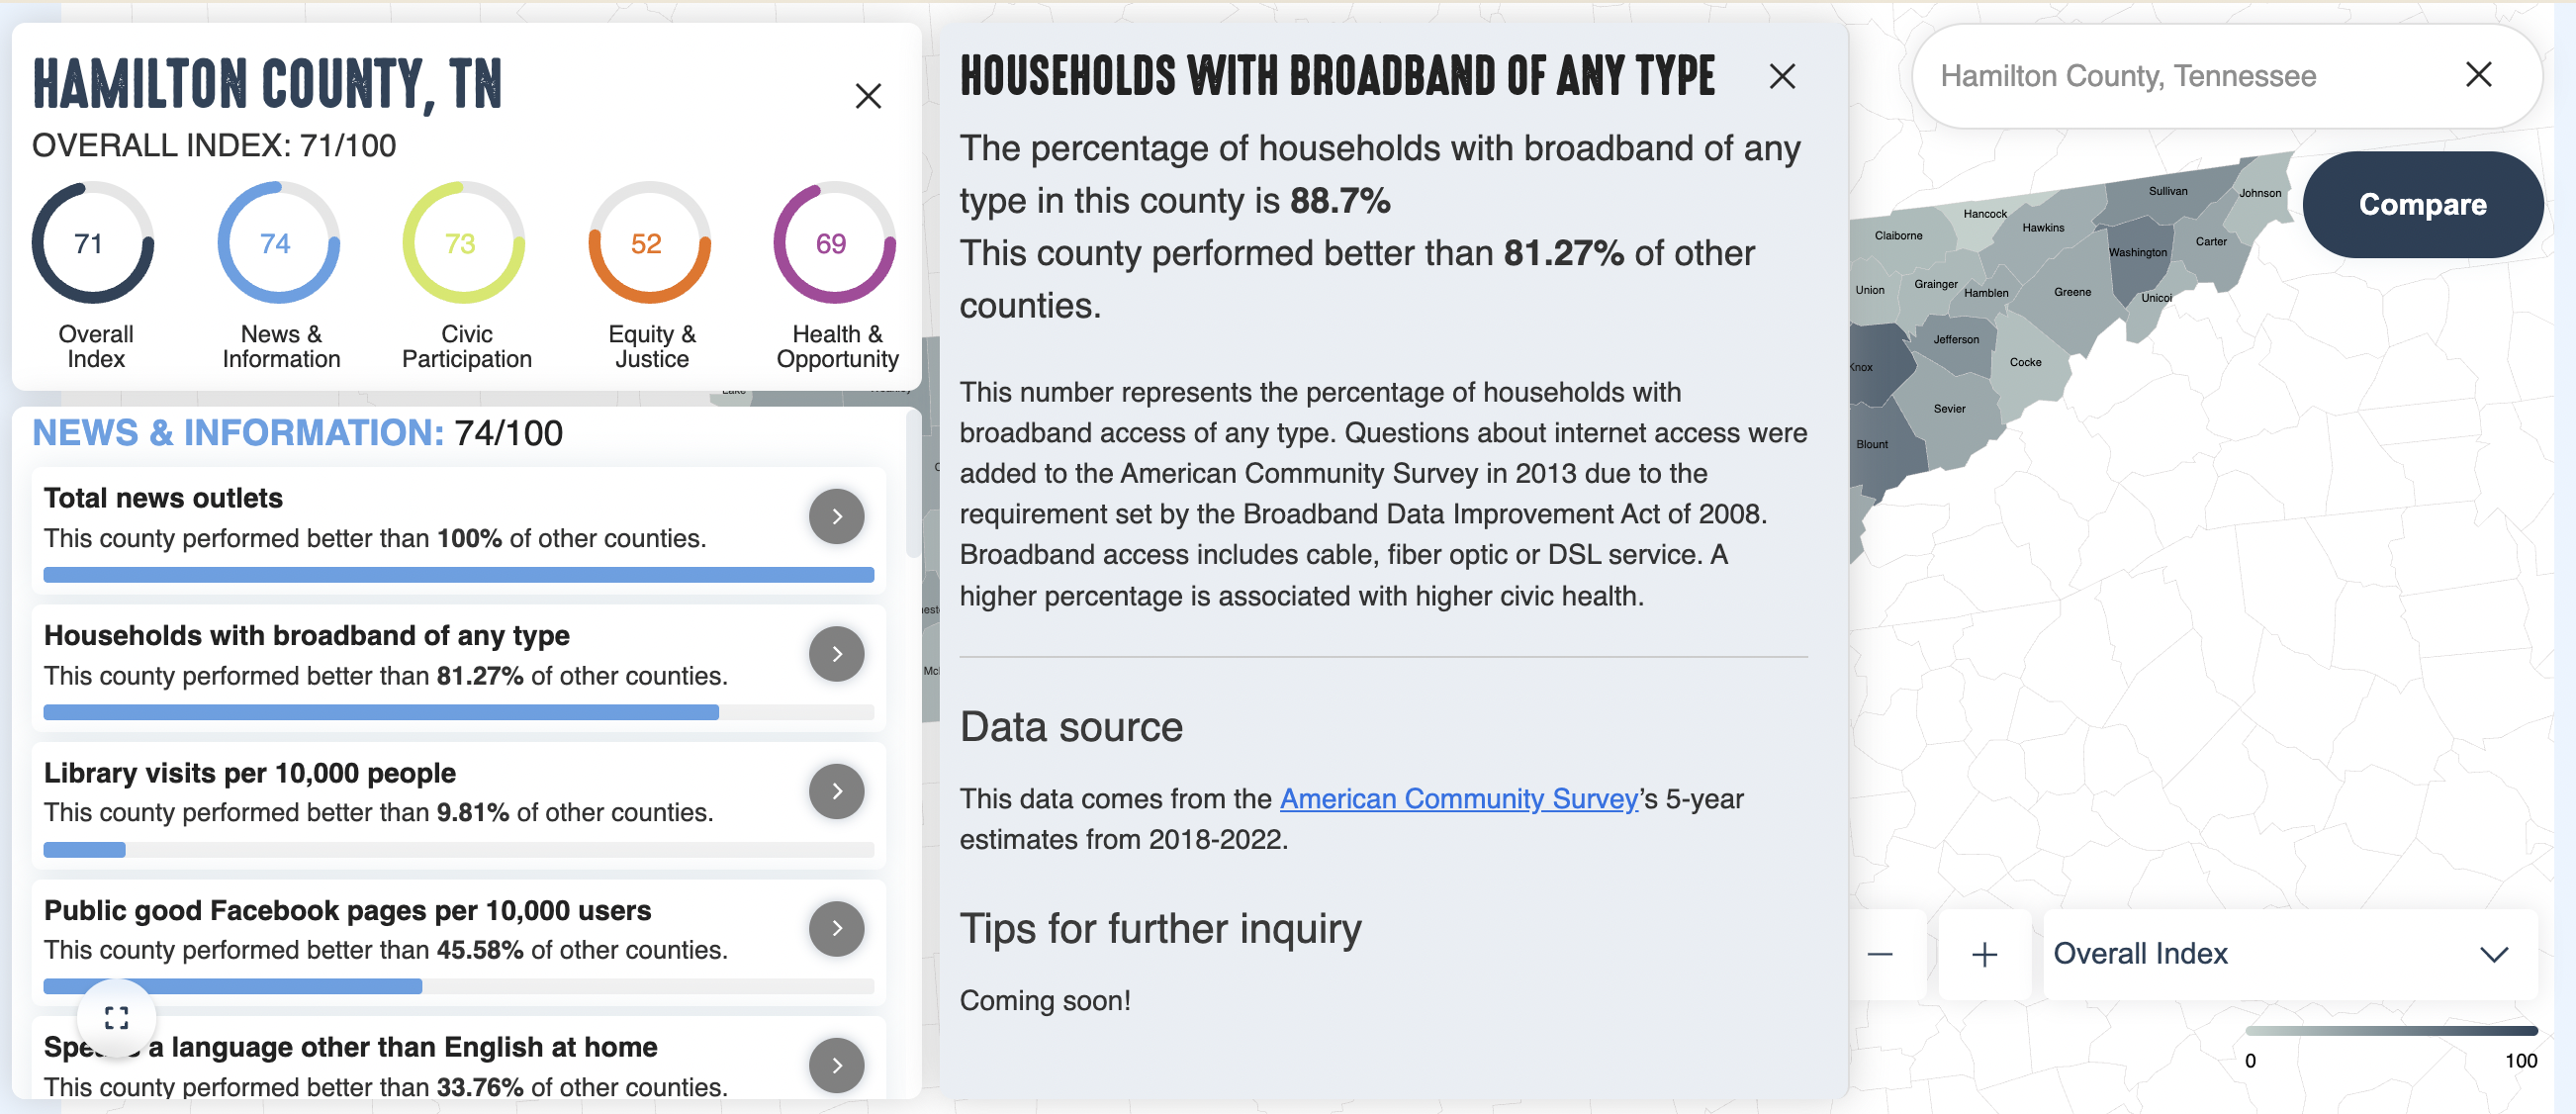
For example, Hamilton County has two or more news outlets, a high literacy score and 88.7 percent of households are connected to broadband, indicating clear strengths in these areas. But the data also shows a higher number of community members who speak a language other than English at home, indicating that the information ecosystem needs to consistently provide culturally competent content in languages other than English. And broadband data needs to be contextualized — in the digital age, the goal should be that 100% of households are connected.

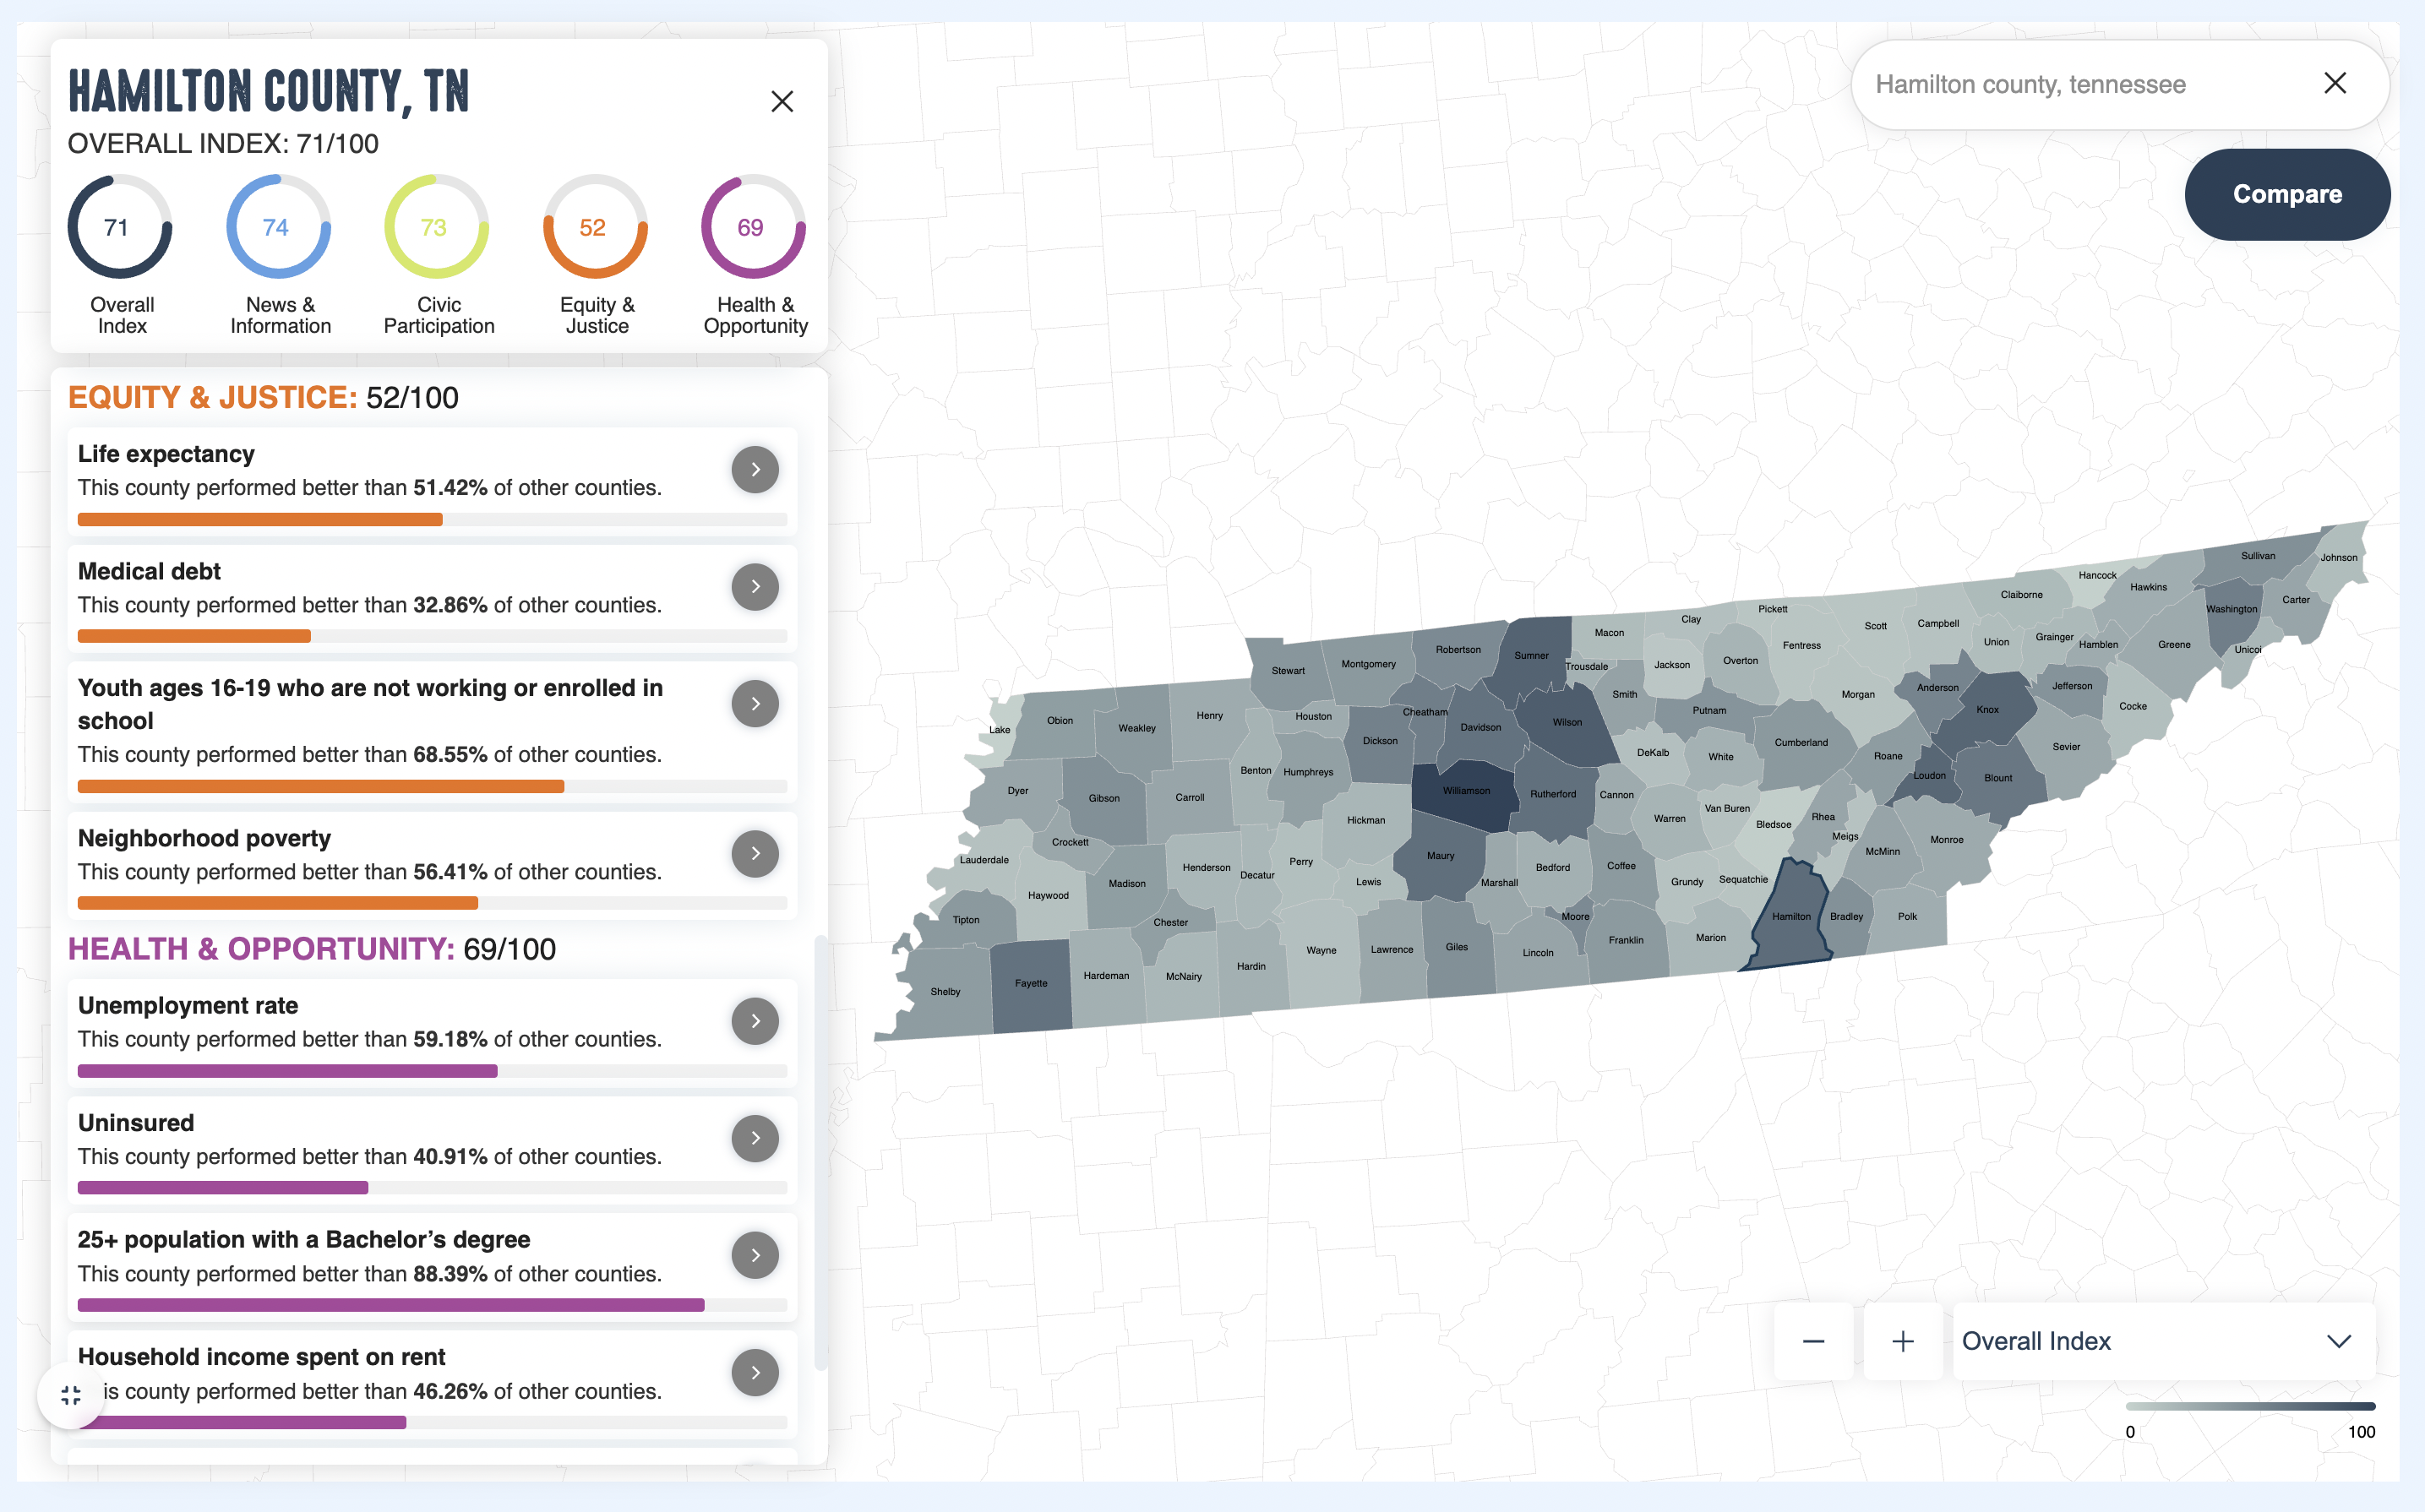
On the equity and justice measures, nearly one in five community members struggles with medical debt. Is this a recent trend? Who is affected? How are people coping? Are there ways to support people in understanding how to respond to high medical bills? These are immediate questions to explore.

Looking across the four pillars allows us to see that the county also performs lower than average on health insurance coverage — 11.8 percent of the population don’t have health insurance — and that voter turnout is low at 61.3 percent, putting the county near the bottom third of counties on this measure. In addition, the Index shows that the county has fewer library visits than 90 percent of counties.
These data points provide opportunities for local newsrooms to investigate potential structural barriers to health, civic participation and information affecting some communities more than others. When reporting on these trends, local newsrooms can also use these insights to ask: How do we reach community members who are not connected to broadband, don’t visit a library, may not be able to pay for news and speak a language other than English at home?
“This data is crucial for justifying funding to expand investigative journalism training at HBCUs. It's not just about diversifying newsrooms but inspiring HBCU journalists to strengthen news ecosystems in the South.”
 Kali-Ahset Amen, Executive Director, Center for Journalism & Democracy, Howard University
Recognizing critical data gaps
As a tool aiming to compile data for all counties in the nation, an Index inevitably misses some more nuanced data that may be available at the local level. At the same time, there are crucial data points — such as how many people are working two or more jobs — that to our knowledge are not currently collected. That’s why we think of this Index as a starting point that provides a framework for local leaders across the civic health ecosystem to connect, collaborate, identify, share and generate additional, locally meaningful data. We look forward to working with many users on enriching and adding to the data provided in the Index.
“It is essential to highlight the need for more localized data. This focus is key to effectively communicating the true impact of this data.”
 Andrea Wenzel, Associate Professor of Journalism, Temple University
Index Methodology
We engaged extensively with an Advisory Group of diverse experts throughout the project to co-develop and refine the Index framework and indicator set. Over the course of four advisory group meetings, members actively contributed to shaping and critiquing the model. To facilitate this collaboration, we provided ample pre-meeting materials, engaged in collaborative dialogue, and used Miro boards during meetings to gather input on elements such as the most relevant civic media definitions, the indicators, and data sources.
Once discussions had led to an initial set of indicators, we identified potential data sources and assessed the quality of and level of trust in the data. Several indicators were severely lacking in data, necessitating their removal. We discussed the available and missing indicators with the group again and solicited further input.
After finalizing a focused set of four pillars and corresponding indicators, we utilized a Qualtrics survey to gauge the relative importance of both the pillars and the indicators. The survey enabled advisory group members to allocate a consistent number of chips (the number of indicators x 10) among the four pillars and within each pillar, providing a quantifiable measure of importance.
With this input on the relative importance of each indicator as well as each pillar, we created the Index. This collaborative and iterative process ensured the Index is comprehensive and reflective of diverse expert input.
Deciding on Indicators
Our approach to selecting indicators was thorough and collaborative, drawing on insights from the Brown University and the Listening Post Collective teams, the Advisory Group, existing literature and established civic health indices. Initially, we compiled an extensive list of potential indicators. We then refined this list to approximately 40 indicators, emphasizing county-level data for a more detailed and localized analysis. Our priority was to source data that was not only publicly available but also up-to-date and relevant for the majority of U.S. counties.
To achieve this, we primarily utilized data from the Census Bureau’s American Community Survey, leveraging five-year averages from 2018 to 2022 to ensure comprehensive coverage, especially for smaller counties. We also utilized data from sources such as the Department of Education, the IRS, the Bureau of Labor Statistics, the Urban Institute, and the Institute of Museum and Library Services Public Library Survey. Despite our extensive search, some indicators were excluded due to the lack of high-quality publicly available data.
Ultimately, our final list comprised 21 indicators, categorized across four key pillars, ensuring a robust and nuanced picture of civic health.
Acquiring the Data
After identifying the appropriate data sources, we systematically downloaded the relevant data files and processed them using R. This step ensured consistency in formatting across different datasets. We then integrated these files into a comprehensive master file encompassing all 3,144 counties and county equivalents, providing a unified and detailed dataset for our analysis.
Constructing the Index Scores
Pre-processing: Our first step was to adjust indicators where a lower value is preferable, such as uninsurance rates, reversing their direction accordingly. We then calculated Z-scores for all indicators to standardize them to a common unit before combining them into a composite index.
Imputation of Missing Values: Given the nature of the data, some counties had missing values for specific indicators. For counties with only one missing value (n = 408), we imputed this value using the Z-score of the most similar county, ensuring consistency after the pre-processing step. To determine the most similar county, we first selected counties with complete data as our comparison group (n = 2,652). For each county with a missing value, we calculated the sum of the absolute differences across the remaining 20 indicators between the target county and all counties with complete data. Additionally, we assessed the population size differences. We arranged the data in ascending order of the sum of differences and population size differences, identifying the most similar county as the one with the smallest sum of differences and the least difference in population size. We then used the value for the missing indicator from this most similar county, replacing the missing value so that the county initially missing one indicator was no longer missing any indicators. This method ensured a comprehensive and accurate dataset, enabling us to maintain the integrity and reliability of our analysis.
Weighting and Calculating the Index
In collaboration with the Advisory Group, we assigned weights to each indicator within the pillars of the Index. As noted above, we used a Qualtrics survey distributed to Advisory Group members to gather input on the relative weight of pillars and indicators. Through this survey, members were given the chance to distribute “chips” among indicators and pillars, reflecting their perceived importance of each. Each indicator then received a specific weight based on the distribution of these “chips.”
After calculating the weighted index for each pillar, we computed a composite index by integrating the weighted indices of all pillars, again guided by the Advisory Group’s input. Once we had calculated the indices for each pillar and the composite index, we converted these indices to percentiles. This percentile scaling method allowed us to easily compare counties. For example, an index score of 80 indicates that a county performed better than 80 percent of other counties. This approach provided a clear and standardized measure of performance across all counties, ensuring comparability and clarity in our analysis.
Mapping the Index
Upon calculating the Index, we utilized Tableau to visualize the data in a comprehensive dashboard format. The main dashboard allows users to view the indices for the four pillars as well as the overall composite index. Counties with two or more missing data points are displayed in gray on the map (n=84).
The “Indicators” tab offers users the ability to search for individual counties and view their specific index values, along with values and percentiles for each individual indicator. This visualization provides a user-friendly interface for exploring the data, facilitating a deeper understanding of the relative performance of each county across various dimensions of the Index.
Download the data
You can download the data that powers the index here.
Data Sources
Pillar / Domain
Conceptual Categories
Indicator
Description
Source
News and Information
Lack of local news sources / presence of “news deserts”
Total news outlets
Number of news outlets in each county, including newspapers, digital sites, public broadcasting and ethnic media. More news outlets are associated with higher civic health.
News and Information
Broadband access
Percent of households with broadband of any type
The percentage of households with broadband of any type. A higher percentage is associated with higher civic health.
News and Information
Library utilization
Library visits per 10,000 population
The number of annual library visits from all libraries in a county per 10,000 population in that county. More library visits are associated with higher civic health.
News and Information
Vibrancy of online engagement on local issues
The number of Facebook Pages predicted to be “Public Good” pages based on page title, category, and other page characteristics, per 10,000 users in the county.
The number of Facebook Pages predicted to be “Public Good” pages based on page title, category, and other page characteristics, per 10,000 users in the county. A higher rate is associated with higher civic health.
News and Information
Language access / English language proficiency
Percent who speak a language other than English at home
The percentage of a county’s residents who speak a language other than English at home. Due to the challenges and potential barriers in multilingual environments, a lower percentage is associated with higher civic health.
News and Information
Literacy levels
Average adult literacy scale score
The average adult (ages 16-74) literacy score according to the Program for the International Assessment of Adult Competencies (PIAAC). A higher score is associated with higher civic health.
Civic Participation Ecosystem
Engagement with political process
Voter turnout (votes/citizen voting age population)
The voter turnout is calculated as a percentage of the citizen voting age population who voted in the 2020 presidential election. A higher voter turnout is associated with higher civic health.
Civic Participation Ecosystem
Community centers / places where people come together
Number of membership associations per 10,000 population
The number of membership associations per 10,000 population, which includes civic organizations, sports organizations, religious, political, business, labor and professional organizations. A higher rate of membership associations is associated with higher civic health.
Civic Participation Ecosystem
Volunteering
Percent of state residents who formally volunteered through organizations
The volunteer rate is the share of state residents who formally volunteered through organizations as indicated on the Current Population Survey’s Civic Engagement and Volunteering Supplement. A higher volunteer rate is associated with higher civic health.
Civic Participation Ecosystem
Giving & philanthropy
Percent of AGI that are charitable contributions
The percent of a county’s total adjusted gross income that is claimed as charitable contributions. A higher percent is associated with higher civic health.
Civic Participation Ecosystem
Opportunities for participation in government / ability to inform government policies
2020 Census self-response rate
The percentage of housing units who self-responded in the 2020 Census. A higher response rate is associated with higher civic health.
Equity and Justice (Structural Determinants)
Life expectancy
General life expectancy at birth
The number of years an individual in any particular county can expect to live. A higher life expectancy is associated with higher civic health.
Equity and Justice (Structural Determinants)
Medical debt
Percent of people with a credit bureau record who have medical debt in collections
The percentage of people with a credit bureau record who have medical debt in collections. A lower percentage who have medical debt is associated with higher civic health.
Equity and Justice (Structural Determinants)
Youth disconnected from work and school
Percent of youth ages 16 to 19 who are not working or enrolled in school
The percentage of youth ages 16 to 19 who are neither working nor enrolled in school. A lower percentage of disconnected youth is associated with higher civic health.
Equity and Justice (Structural Determinants)
Neighborhood poverty
Percentage of the population living in high-poverty neighborhoods, defined as census tracts with a poverty rate of 20 percent or higher
The percentage of a county’s population living in high-poverty neighborhoods, defined as census tracts with a poverty rate of 20 percent or higher. A lower rate of neighborhood poverty is associated with higher civic health.
Health and Opportunity (Social Determinants)
Economic stability
Percent of population unemployed
The percentage of the county’s labor force population that is unemployed. A lower unemployment rate is associated with higher civic health.
Health and Opportunity (Social Determinants)
Access to healthcare and preventative care
Percent of <65 population uninsured
The percentage of the non-elderly (<65) population that is uninsured. A lower uninsured rate is associated with higher civic health.
Health and Opportunity (Social Determinants)
Access to education and lifelong learning
Percent of 25+ population with a bachelor’s degree or higher
The percentage of the 25+ population with a bachelor’s degree or higher. A higher educational attainment rate is associated with higher civic health.
Health and Opportunity (Social Determinants)
Access to basic needs: Housing, food, clean water and clean air
Median gross rent as a percentage of household income in the past 12 months
The median gross rent as a percentage of household income in each county. A lower percentage spent on rent is associated with higher civic health.
Health and Opportunity (Social Determinants)
Access to basic needs: Housing, food, clean water and clean air
Percentage of population who lack adequate access to food
The percentage who did not have access to a reliable source of food during the past year. A lower percentage is associated with higher civic health.
Health and Opportunity (Social Determinants)
Access to transportation
Percent of households with no vehicle available
The percentage of households with no vehicle available. A lower percentage is associated with higher civic health.
