


Insights
Graphic of a person interviewing another person.
Overall Findings
Given the diversity of communities, opportunities and challenges present across the United States, the main purpose of the Civic Information Index is to allow localized assessments of key factors that drive civic health.
At the same time, the Civic Information Index reveals regional disparities in civic health. In the 2026 Index, the essential findings from the 2024 edition have not changed: The Index continues to show lower civic health scores for Appalachian communities as well as most communities with a higher percentage of Black, Hispanic/Latino or Native American residents.
Lower Index scores continue to correlate with regions historically affected by racial and economic discrimination.
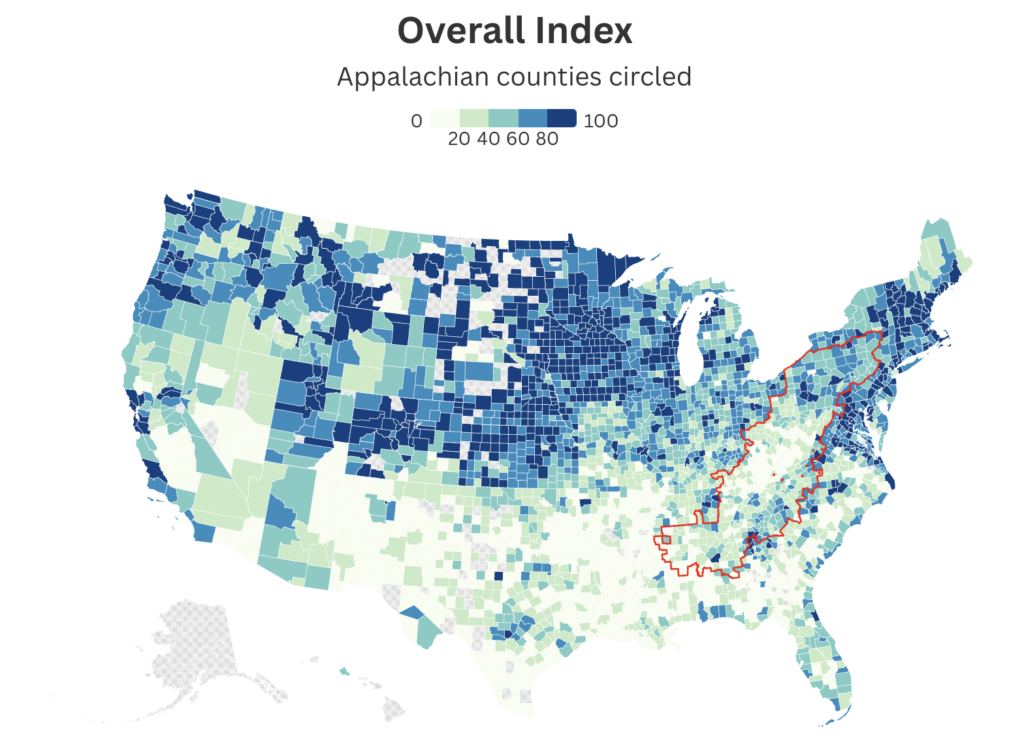
Appalachia
The Index reveals the profound civic health disparities in Appalachia, a region historically impacted by economic hardship and geographic isolation. Despite its rich cultural heritage, the area struggles with lower civic participation and access to critical resources, underscoring the need for targeted interventions. Economic stability, access to food, housing, affordable healthcare and trusted information remain significant challenges for these communities.
By including structural determinants such as neighborhood poverty, youth disconnected from school or work and life expectancy, the Index is built to capture such dynamics and show where outcomes are inequitable.
Black Communities
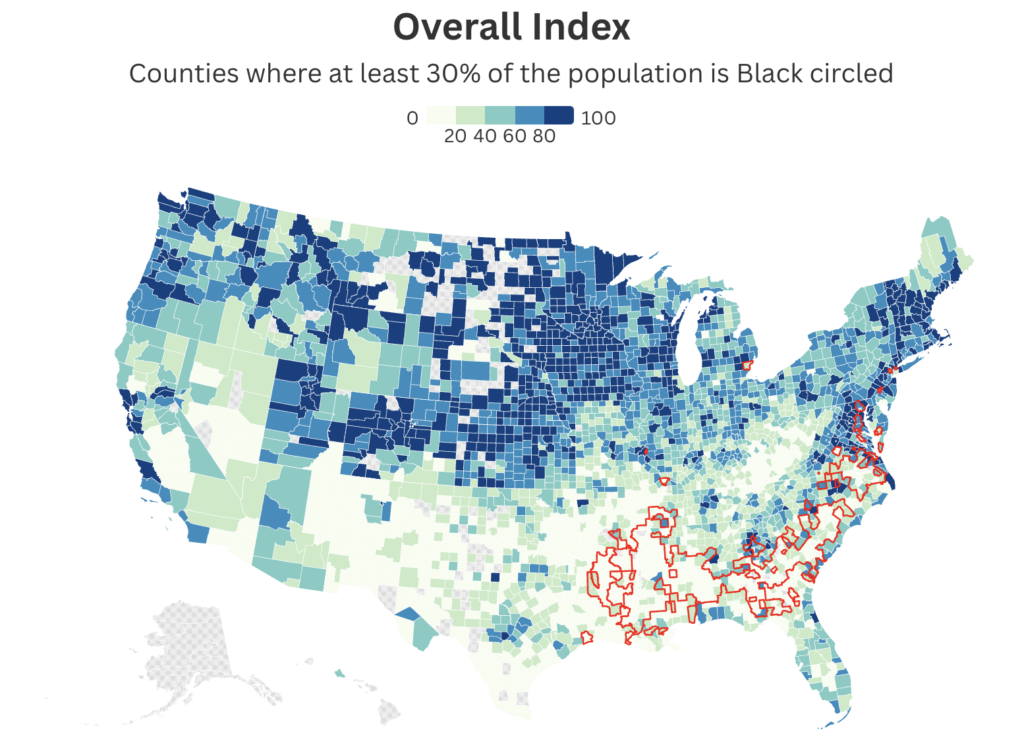
Black communities, particularly in the South, exhibit stark disparities in civic health due to centuries of systemic racism and disenfranchisement. The Index highlights how these regions consistently score lower, showing how historical marginalization continues to affect civic engagement and access to essential services. Voting rights and civic participation remain critical issues, as these communities face ongoing barriers to full civic involvement.
Hispanic/Latino Communities
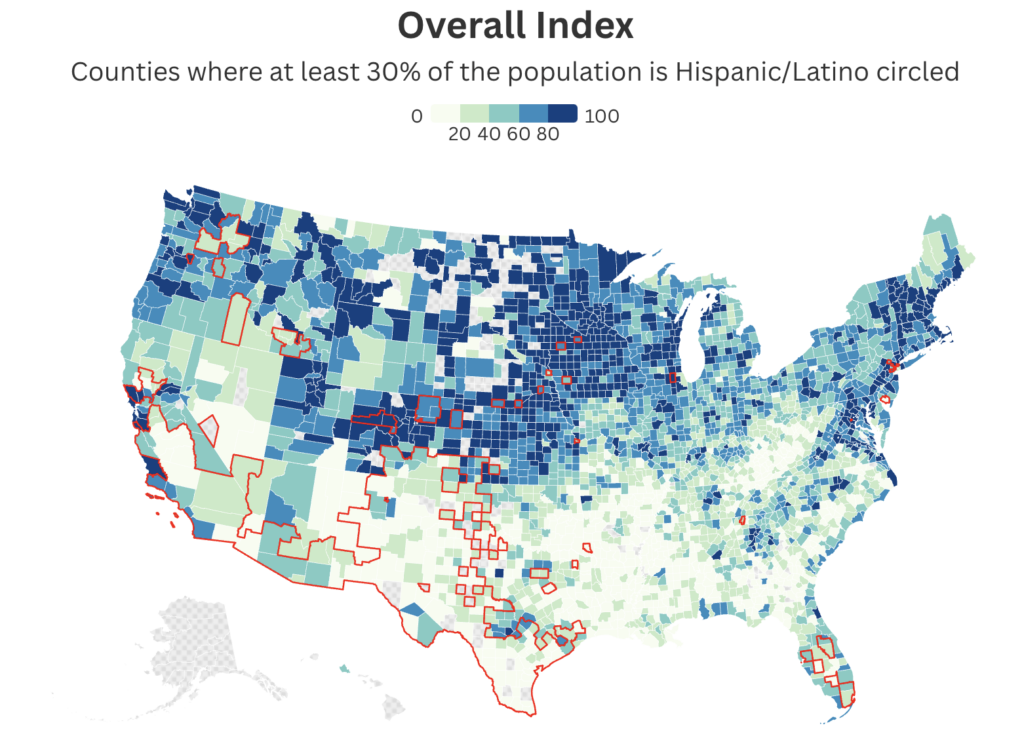
Hispanic and Latino communities, especially in the Southwest, face significant challenges in civic health, often exacerbated by language barriers and immigration status. The Index maps reveal these communities’ struggles with lower access to basics such as employment, housing and food as well as information and civic participation, calling for inclusive and culturally competent solutions. Factors such as the percentage of families who speak languages other than English at home and access to broadband are crucial indicators in understanding these disparities.
Native American Communities
Native American communities, particularly those on reservations, display some of the lowest civic health scores in the Index. Historical and ongoing marginalization, along with geographic isolation, contribute to these disparities, highlighting a critical area for civic and policy interventions.
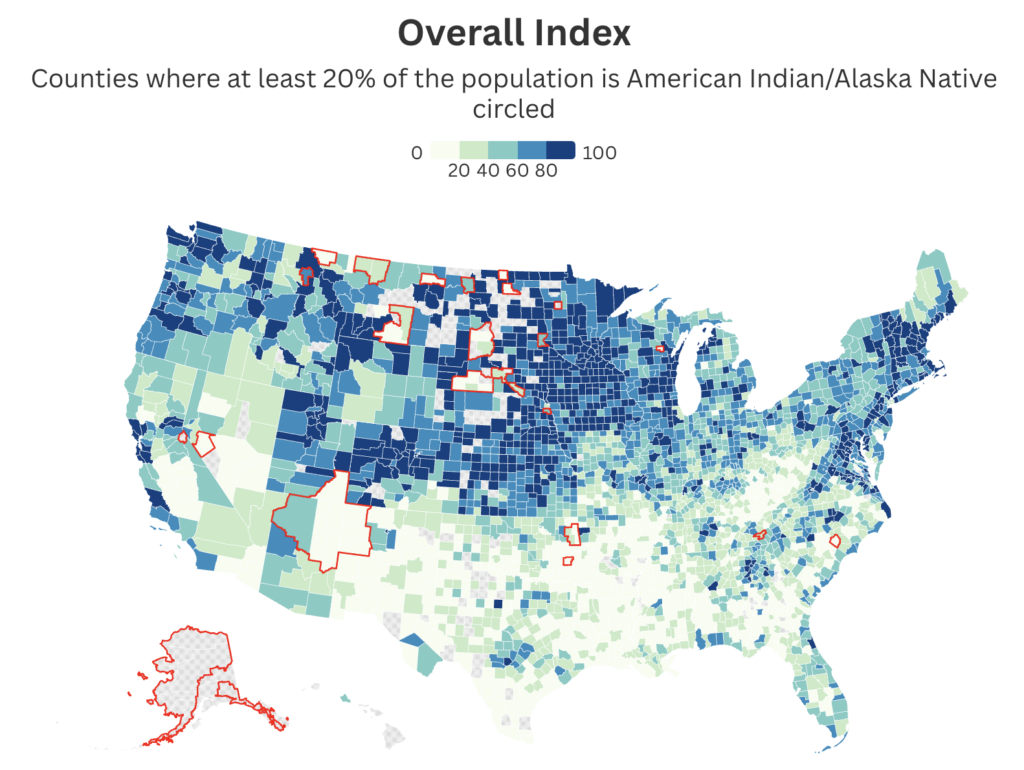
2026 Civic Information Index Findings
The new Environmental Resilience Pillar similarly shows lower scores in Appalachia as well as Black, Hispanic/Latino and Native American communities, adding to our understanding of the persistent and systemic challenges faced by these communities.
However, the Environmental Resilience Pillar also reveals significant vulnerabilities in other regions – particularly, the mid- and South-central states, and in some counties in the West. Given the data currently included in the Index, these results illuminate an important interplay between environmental stressors (such as extreme storms, wildfires, floods, heat waves and cold spells) and the politics of essentials such as disaster relief and energy pricing, which impact the ability of people and communities to stay safe and recover quickly.
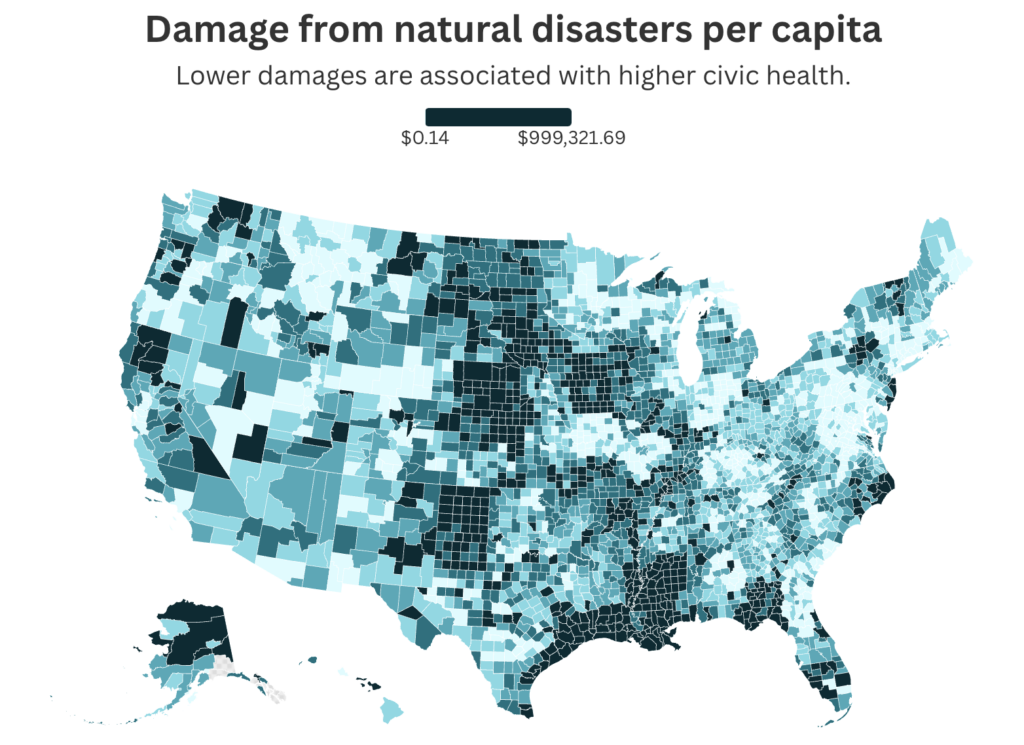
Damage from Natural Disasters
This map shows the damage from natural disasters to property and crops over a 20 year time frame (inflation-adjusted). It illustrates the disproportionate burden carried by Central states all the way from North Dakota to Kansas to Louisiana. Over 40 event types are included in this data, such as floods, storms, wildfire and tsunamis.
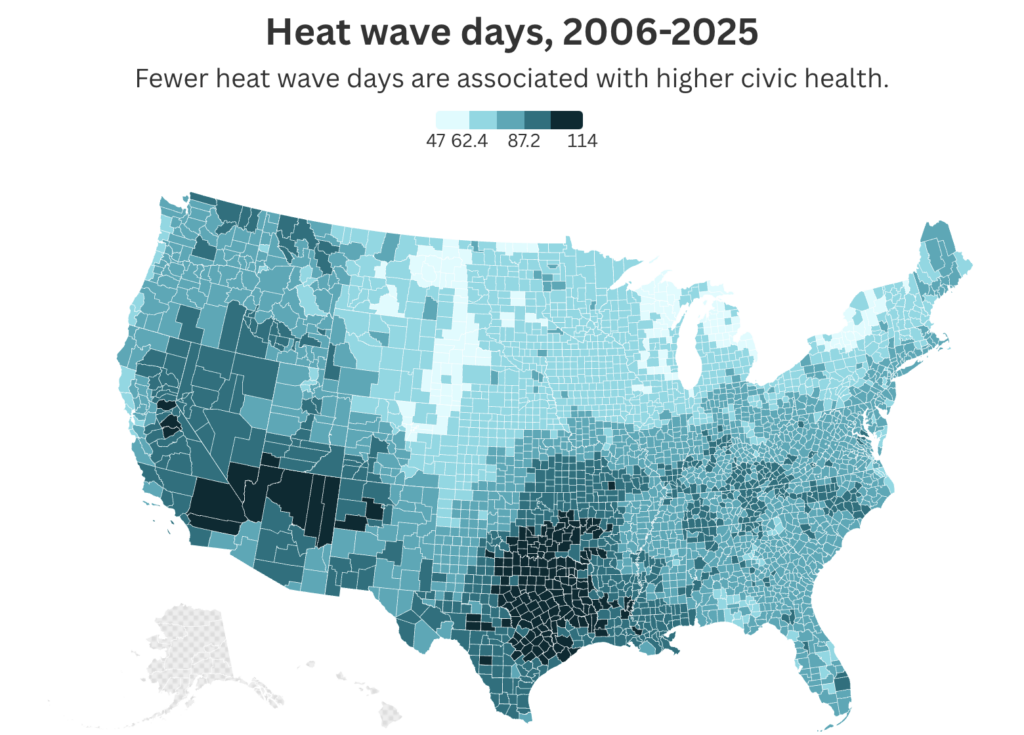
Heat Wave Days
This map shows where increases in temperatures and heat wave days are most pronounced, revealing significant risk in Southern and Southwestern regions, but also in the Northwest, Northeast and even some counties in the Midwest. It demonstrates the importance of tracking these changes everywhere, not just in the hottest counties.
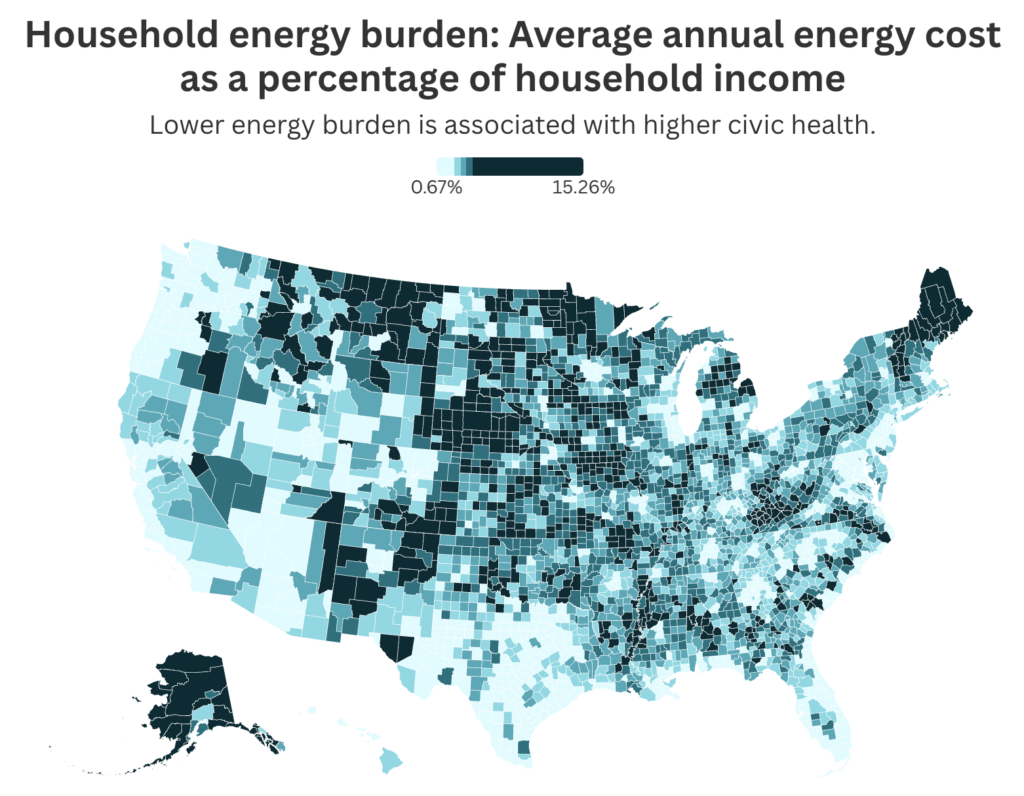
Household Energy Burden
This map shows how much of their income U.S. households are paying for energy (electricity and/or gas). It makes visible that paying for heat in colder climates is still a higher burden for households than paying for cooling in warmer climates; but economically distressed regions such as the central South and central Appalachia also see high burden. Index users should investigate both people’s incomes and local energy costs to assess local dynamics.
Registered vs. Active Voters
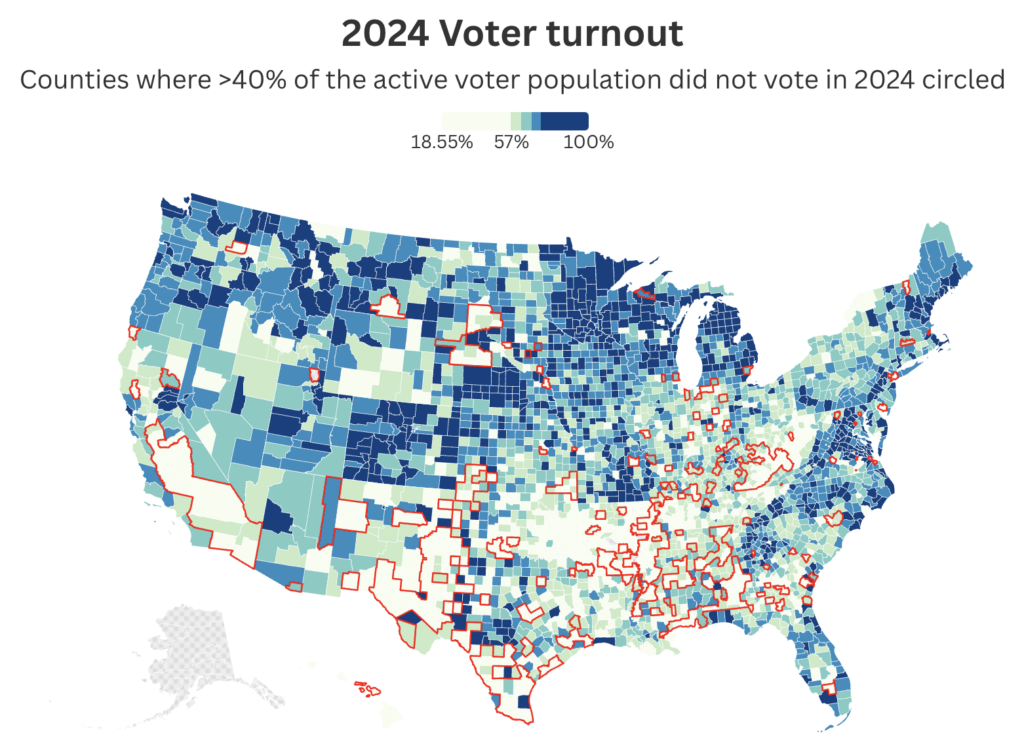
This map shows updated 2024 voter turnout data, with an overlay of countries marked in red where more than 40 percent of the registered voters (also called ‘active’ voters) did not vote in 2024. We include a new data set of active voters in the 2026 Index because it turns out voter registration and voter turnout don’t always correlate – especially in some key Black and Hispanic/Latino communities.
News Deserts vs. Journalists
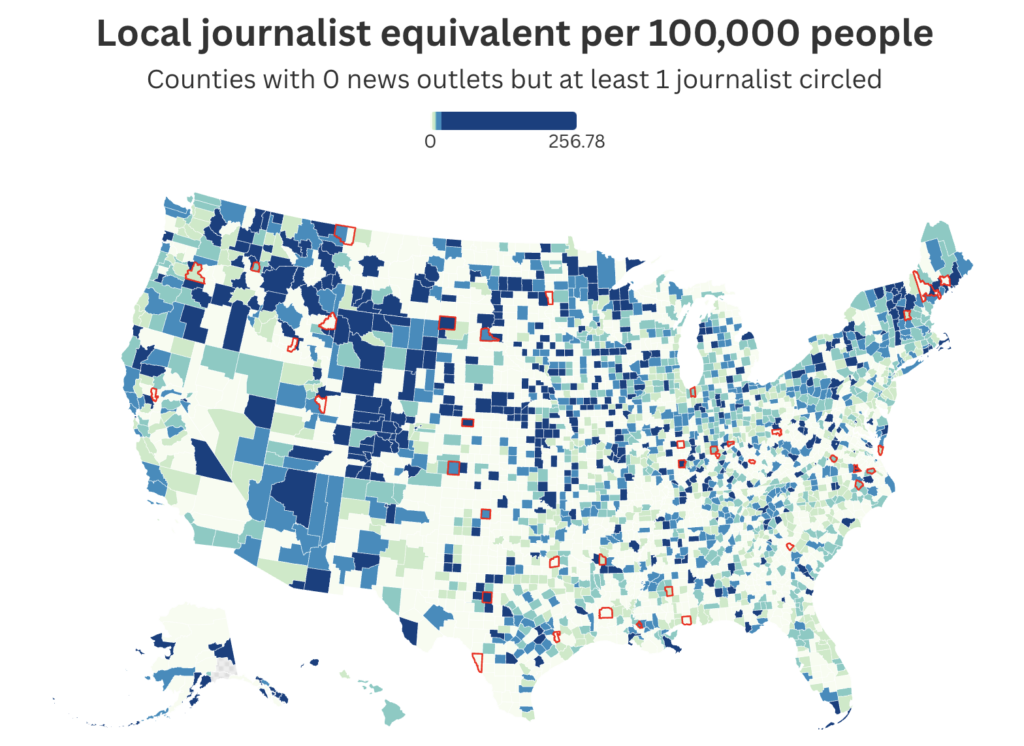
This map shows a new Index dataset calculating the number of journalists present in a community. Comparing it to our existing dataset of news deserts, which counts the presence of news outlets, we noticed that the two data sources often don’t correlate. For example, circled in red here are counties considered news deserts where journalists were found present.
Why we are not comparing 2024 and 2026 Index scores
Given the updates made to our Index framework, we are not providing comparisons of overall Index scores or individual pillar scores between the 2024 and 2026 Index editions. It would be like comparing apples to oranges since the data inputs and weights have changed
What we see in the new data is that for most communities, overall Index scores have not significantly changed. This shows the Index is robust, as our framework measures performance across diverse factors over time. It also aligns with the fact that most of the updated data in this 2026 edition was collected before 2025, so the data represents trends before the more recent and significant disruptions to civic society emerged.
In a small number of communities, overall Index scores have changed more visibly. This means our new combination of data sets puts your county in a different space compared to others, based on what is now included in the Index. For example, in many counties in Wyoming, a decrease in the state’s volunteer rate caused the overall index scores to drop. In such cases, it’s especially interesting to dive into what drives these changes locally. In the case of Wyoming’s volunteer data, why did it drop by 5.7 percent between 2021 and 2023? Note that we are also seeing other civic participation indicators such as voter turnout decline in Wyoming — a trend worth investigating. In other cases, shifts in overall Index scores may be due to newly added data. For example, the inclusion of energy burden and storm damage may put your county in a better or worse position.
In another case, it may be a methodological reason: For example, we had to change the source of voter turnout data. The new data source, the United States Election Assistance Commission, aggregates data from state and local jurisdictions and exhibits higher reliability than our previous dataset for this past election.
A change to a new data set, collected by a different institution with a different methodology, inevitably means that the outcomes are likely not to be exactly the same. If this is your community, think of it as an opportunity: What do you know about voting participation, and who is counting? How may this data, including discrepancies, lead you to a better understanding of who in your communities turns out to vote?
2024 Index Indicators where new data is available
The new Index also provides updated data for 18 of the 21 indicators included in the initial 2024 edition. This means that in specific cases we can use the Index to track changes in individual data sets — like how have employment rates changed between the 2024 and 2026 edition; and is medical debt going up or down in a specific community. Users can explore these changes in the data for 10 of the updated indicators (8 more indicators have updated data, but comparing these data sets is not recommended due to methodological changes or other data constraints.)
Changes in Medical Debt
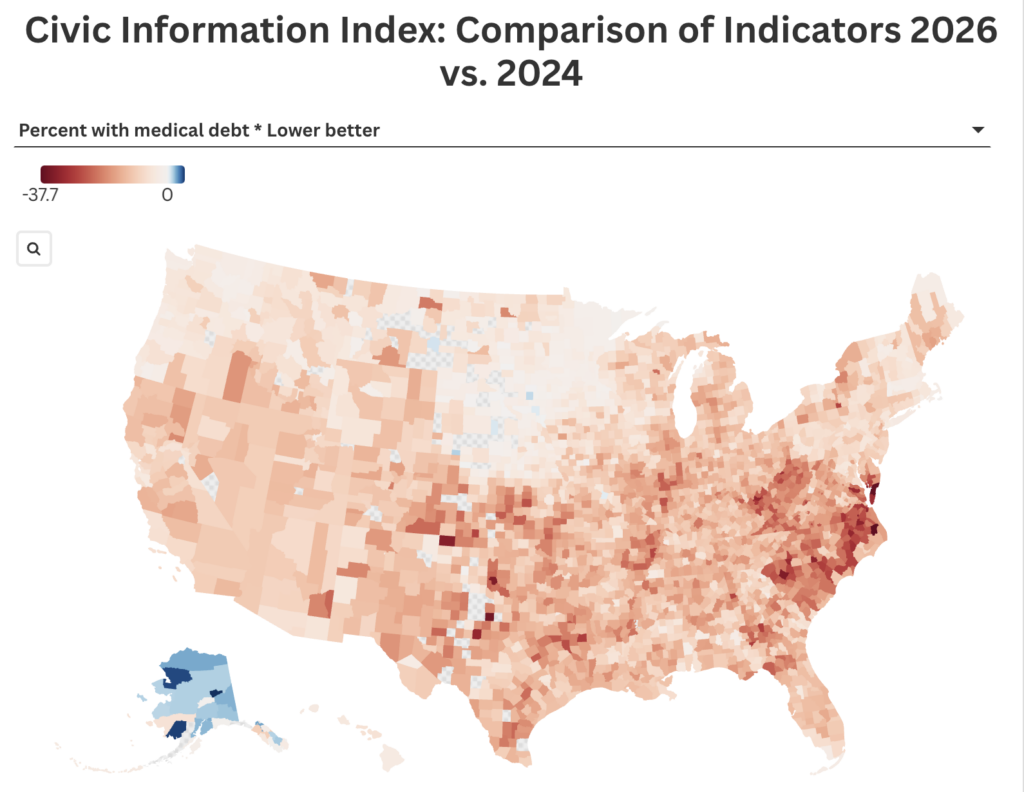
As the map below shows, medical debt has gone down in most places across the country, a piece of good news. Changes in hospital billing practices happened for different reasons in different locations, including journalism revealing the crippling impact on families, community backlash and activism, and political leadership and stricter policies. North Carolina for example implemented a strict debt relief program moving 2.5 million residents out of medical debt – a bright spot clearly visible on the map. The map also shows that Alaska has moved in the opposite direction, a concerning development. And recent changes in medical debt policies and access to medicare may quickly reverse this trend in 2026. Thanks to the great database from the Urban Institute, we’ll all be able to keep tabs.
Pro tip: If you are especially curious about how the recent upheavals at the federal level are impacting your community, make sure you check when the new data for a specific indicator was collected. Some updated data is from 2025, but some is from 2024 or earlier.
Key Takeaways
The Civic Information Index allows a fresh look at the cumulative impact of how different policies, local cultures, and the ways in which we design our systems—such as the political or information ecosystem—are impacting people and communities.
These are the 12 most important insights we learned from the Civic Information Index project so far:
A higher number of media outlets does not equal better civic health.
The existence of lots of media outlets does not necessarily mean a community is better informed, more engaged, or has better civic outcomes. For example, not all outlets presenting as local news sources actually deliver local news in a meaningful way. Also, language, platform, literacy, history and many other factors can impact effectiveness and trust within local information ecosystems — and information ecosystems are only one part of local civic health ecosystems.
News media is a part of the civic health ecosystem.
This index frames News and Information as one of four key domains that drive civic health. To contribute to the collective goal of better civic health, media practitioners benefit from recognizing their work as part of this collaborative effort, alongside other civic actors such as power-building organizations, local funders and community health workers.
Focusing on outcomes creates a shared language.
This Index provides funders, media outlets, community stakeholders and others with a common language, and allows actors across the civic media ecosystem to recognize each other’s efforts, how they are connected, and how they can support each other. For example, a news outlet might work with a community organization serving unsheltered people on better understanding how a local increase in heat waves is impacting this population, and what government action may be needed to better prevent an increase in hospitalizations and deaths. Similarly, the Index also introduces language that is likely more familiar to community members, which will support newsrooms in communicating about the importance of news as a critical part of local infrastructure.
By uniquely connecting diverse indicators, the Index provides new ways of looking at opportunities and outcomes at the community level.
This Index brings together existing and novel indicators across the broader civic health ecosystem. By including factors such as language spoken at home, social media data, life expectancy and high poverty neighborhoods, it offers a fresh perspective on the diverse drivers of civic health.
Listening to data matters.
By assessing local Index scores for their communities, media innovators and their partners can discuss the findings and dig deeper on what drives each outcome and the challenges and opportunities it represents. For example, a community might struggle with high poverty neighborhoods or food insecurity, but it also might have robust engagement with the local library, identifying libraries as an important space to engage community members. Collaborators can further investigate what additional data might be.
The Index is a starting point and a resource to build on.
The Index serves as a guide for targeted action around how to better assess and execute efforts to strengthen local information ecosystems and improve civic health. Local engagement with and contextualizing of the data is essential to understanding local realities and adding to the Index’s findings.
Collaboration is key.
The Index was created through a collaborative process and is designed to foster more collaboration. It provides news media, communities and funders with a starting framework as they build equitable and purposeful partnerships to assess and enhance civic engagement and information ecosystems across the U.S.
Community-driven local assessments empower community action.
News media and their local civic partners can play an important role in facilitating community-led data collection and interpretation. By developing tools for community engagement in and feedback on civic health efforts, such as surveys, interviews or town halls and community conversations, and adopting citizen science approaches, news media organizations and their collaborators can empower communities to take the lead in defining and assessing civic health locally, and in shaping community action.
Invest in community power building.
Community power building — power that is exercised by residents to influence civic life through a variety of channels — is crucial for increasing equitable civic engagement. This includes creating definitions and frameworks that recognize and highlight diverse community perspectives, especially those often overlooked.
High civic engagement and equitable civic engagement are not the same.
When assessing the strength of local civic engagement, volume isn’t the only measure that matters. Representation of all parts of the community matters. Since underserved populations are often smaller in numbers, local engagement may be high but completely missing voices from some populations. Also, it remains important to elevate the voices of those who are most impacted by negative outcomes.
Significant improvements in civic health take time.
As updated data becomes available over time, this Index will allow communities to assess if civic health outcomes are improving. This process will take time, however, and early localized efforts may manifest in smaller, incremental successes.
We can scale by building upon existing efforts across the civic health ecosystem.
The goal of this Index is not to reinvent the wheel, but to connect and add to existing knowledge, partnerships and efforts. Often, what needs to change is the barriers to collaboration — for example, there are still many barriers for journalists to engage more directly at the community level. Together, local media, community-based organizations, academic institutions, government, funders and others can explore how the Index results are resonating, how different organizations might use the Index in their work, what efforts are already underway and how the collective work might best be supported and expanded.
Recommendations
The first edition of the Civic Information Index has shown us that local data, in different hands, can help build civic health ecosystems in a variety of ways. Funders have used it to build investment strategies; newsrooms have used it to find underserved communities; students have used it to listen more carefully; and advocates have used it to make the case to Congress to preserve community media
“Our greatest challenge is that our civic infrastructure — all the institutions and organizations that give people opportunities to solve problems, build community, and help make public decisions — is out of date. To update it, we need to know how people are thinking about those opportunities, how they are working, and why they are valuable”

Building on what we have learned from these early adopters, we propose the following actions to guide the establishment of more robust, equitable information and civic health ecosystems.
Funders
- Prioritize funding for parts of the country in need of investment based on Index outcomes.
- Recognize and fund civic media and information efforts as an ecosystem model.
- Encourage and incentivize collaboration between outlets, journalism support organizations, civil society groups and academic institutions.
- Fund research around civic data identified via this Index as missing but necessary.
- Recruit additional funding institutions with expertise outside of journalism to partner in this effort.
Local and national news outlets
- Prioritize reporting that explores important storylines emerging from some of the Index data and investigate the civic health of specific regions or communities.
- Use the Index and available community information needs data to deliver reporting in more nuanced and equitable ways.
- Partner with mutual aid groups to identify and reach community members who are disconnected from formal information channels, and to ensure that reporting on civic health issues reflects the lived experience of those most affected.
Journalism Support Organizations
- Partner with funders and local media and civic society actors to map information needs, including where and how to reach people with information, and build more robust local ecosystems.
- Share existing tools and expertise. Use the Index to foster more collaboration and especially coordination with peer organizations based on specific local needs in different parts of the country.
Local civil society actors
- Use the Index to advocate for more support in local communities around improving information access to strengthen civic health.
- Partner with outside institutions to bring expertise and tools that can benefit local efforts to build sustainable information ecosystems.
- Educate funders, media outlets, journalism support organizations and academic institutions on local context for working in specific communities and ground them in an understanding of existing information ecosystem work and gaps.
Academic institutions
- Serve as local anchor institutions by partnering with local media and community stakeholders on collaborative and engaged research and providing technical assistance.
- Host partnerships between local and outside collaborators, provide monitoring and evaluation of local efforts to build information ecosystems, and publish local impact assessments related to these efforts, involving students in the process of research and research-informed collaborative initiatives.
Collective Efforts
There is a great opportunity to combine forces around data collection and sharing. We encourage all of the institutions mentioned above to find ways to collaborate around supporting local civic data collection efforts. For example, partnerships could develop standards around community engagement in data collection and standards for data collection around community information needs, with options for customization at the local level.