
The Framework
Graphic of woman holding a child and a man laying.
Introduction
The Civic Information Index (CII) is designed to grow. When we launched the first edition in fall 2024, we shared that the framework was a starting point — a foundation to build on as new data becomes available, as our understanding of civic health deepens, and as the communities and stakeholders using the Index help us see what’s missing.
Thanks to this collaborative, collective work, the new 2026 Civic Information Index features some important additions: We have expanded the framework from 21 to 27 diverse data sets to assess civic health at the county level. By mapping news and information ecosystems, civic participation, and drivers of equity, health, opportunity and – newly added – environmental resilience, the Index makes the overall wellbeing of neighborhoods, communities, states and the nation visible and measurable in new ways.
While traditional measures of civic health focus mainly on aspects such as voter turnout and philanthropic giving, the Civic Information Index goes further. It examines a broader set of factors — from housing and food insecurity to disconnected youth to the presence of newsrooms and journalists —that shape how communities function, connect and thrive.
“Establishing this as an ecosystem is essential. We need to measure things that aren’t currently being measured to understand their true impact on community health and engagement.”

“Being able to see, at a glance, a county’s civic health, and how it compares to others, is invaluable. Seeing how the structural features of communities are related brings a new level of insight to my work.”
The Index Framework
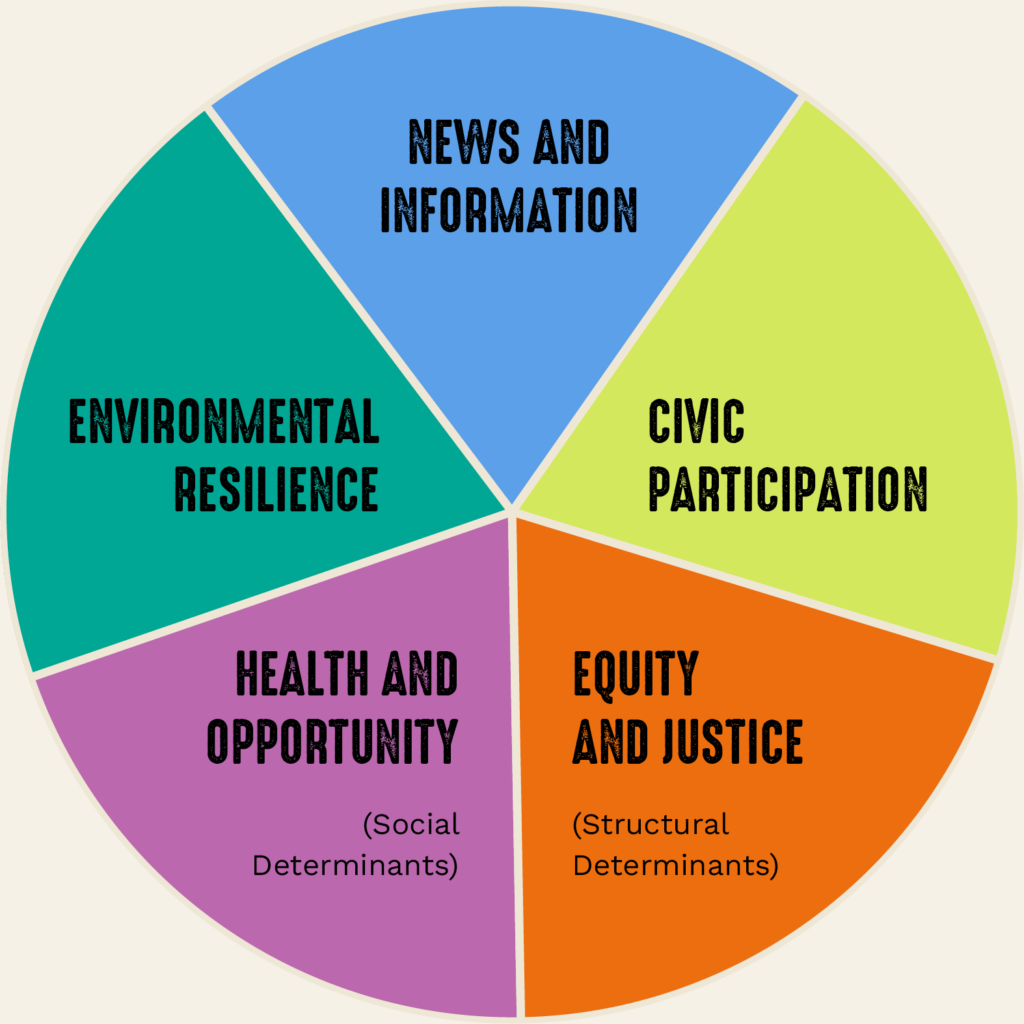
The Civic Information Index is based on a conceptual framework that organizes the civic health ecosystem into five pillars:
- News and Information
- Civic Participation Ecosystem
- Equity and Justice (Structural Determinants)
- Health and Opportunity (Social Determinants)
- Environmental Resilience
The Index framework provides key data points — also called indicators — within each of the five pillars of the civic health ecosystem. Better outcomes on these indicators means a community has higher civic health. Sometimes, an indicator was found to be essential to civic health — such as people’s sense of belonging — but no quality data to measure it was available for all or most counties in the U.S. In these cases, the indicator is still included in the framework but marked as “not currently measured.” We encourage local efforts to investigate if nationally missing data may be available for their communities.
“In places like Baltimore, where infrastructures are threadbare, civic participation thrives through cultural practices like block parties, neighborhood meetings and parades where people can also register to vote.”

The Five Pillars of Civic Health
1. News and Information
Vision: People have access to and engage with trustworthy, credible information about issues affecting their lives and communities. Information is available in ways that meet community members’ cultural context, consumption habits, languages spoken and information needs — and is delivered by sources they trust. The information infrastructure promotes an inclusive and equitable public sphere. Digital and media literacy are part of public education and support for public service media is sufficient to meet community information needs. Journalism is independent, journalists are safe, and the media landscape is representative of and supported by the community.
How the Index frames and measures news and information:
| Category | Indicator |
|---|---|
| Lack of local news sources / presence of “news deserts” | Total news outlets per 10,000 population |
| Presence of journalists (new) | Local Journalists per 100,000 population |
| Broadband access | Percent of households with broadband of any type |
| Library utilization | Library visits per 10,000 population |
| Vibrancy of online engagement on local issues | The number of Facebook Pages predicted to be “Public Good” pages based on page title, category, and other page characteristics, per 10,000 users in the county |
| Language access / English language proficiency | Percent who speak a language other than English at home |
| Literacy levels | Average adult literacy scale score |
| Community diversity represented in newsroom staff / news coverage | Not currently measured |
| Multilingual Media | Not currently measured |
2. Civic Participation Ecosystem
Vision: People have opportunities to participate in civic life and they do so with some frequency. People are represented equally, their voices are heard, and they are able to shape programs and policies that affect them. The community is governed by a functioning, representative government and elections are free and fair. Processes are in place for all community members to be able to provide input on a sustained basis and access information that connects them to basic public services. People feel connected and know how they can get engaged — be that in the political process, volunteering, community engagement, advocacy, or other ways to serve, lead and affect change.
How the Index frames and measures civic participation and civic life:
| Category | Indicator |
|---|---|
| Engagement with political process | Voter turnout (votes/citizen voting age population) |
| Ability to participate in political process (new) | Voter registration |
| Community centers / places where people come together | Number of membership associations per 10,000 population |
| Volunteering | Percent of state residents who formally volunteered through organizations |
| Giving & philanthropy | Percent of adjusted gross income that are charitable contributions |
| Opportunities for participation in government / ability to inform government policies | 2020 Census self-response rate |
| Community power-building organizations | Not currently measured |
| Social connectedness & people’s sense of belonging | Not currently measured |
| Civic education & civic attitudes | Not currently measured |
| Representation in positions of power | Not currently measured |
| Community members’ sense of what is important for the community | Not currently measured |
3. Equity and Justice (Structural Determinants)
Vision: People are free of structural barriers to civic engagement, accountability and change. Regardless of race or ethnicity, physical or mental abilities, age, gender or other factors, all people have equal access to civic life and opportunity. Structural racism, ableism, economic discrimination and other forms of oppression are dismantled, and all members of a community are able to thrive.
How the Index frames and measures civic participation and civic life:
| Category | Indicator |
|---|---|
| Life expectancy | General life expectancy at birth |
| Medical debt | Percent of people with a credit bureau record who have medical debt in collections |
| Youth disconnected from work and school | Percent of youth ages 16 to 19 who are not working or enrolled in school |
| Neighborhood poverty | Percentage of the population living in high-poverty neighborhoods, defined as census tracts with a poverty rate of 30 percent or higher |
| Historical news deserts | Not currently measured |
| Cost of Voting | Not currently measured |
| People working two or more jobs | Not currently measured |
4. Health and Opportunity (Social Determinants)
Vision: People have access to the basic foundations of a healthy life, which are essential to people’s ability to sustainably participate in society. This includes economic stability; community connection and safety; access to healthcare, education, transportation and basic needs (housing, food, clean water and clean air); and environmental disaster resilience.
How the Index frames and measures health and opportunities:
| Category | Indicator |
|---|---|
| Economic stability | Percent of population unemployed |
| Access to mental health care (new) | Mental health providers per 10,000 population |
| Access to healthcare and preventative care | Percent of <65 population uninsured |
| Access to education and lifelong learning | Percent of 25+ population with bachelor’s degree or higher |
| Access to basic needs: housing, food, clean water and clean air | Median gross rent as a percentage of household income in the past 12 months |
| Access to basic needs: housing, food, clean water and clean air | Percentage of population who lack adequate access to food |
| Access to transportation | Percent of households with no vehicle available |
| Environmental disaster resilience* | Not currently measured |
| Violent crime rates | Not currently measured |
| Vaccination rates | Not currently |
5. Environmental Resilience
People live in neighborhoods that support individual and community wellbeing, including the presence of green space, walkability/bikeability, clean air and sustainable living, working and transportation practices. Communities are built and governed to withstand the physical impacts of environmental hazards and a changing climate; local systems are equipped to prevent harm and respond quickly when challenges occur. The burden of environmental risk is shared equitably, and no neighborhood is systematically more exposed to environmental threats because of its racial or economic composition.
| Category | Indicator |
|---|---|
| Economic stability | Percent of population unemployed |
| Affordability of protection from heat/cold | Average annual energy cost as a percentage of annual household income |
| Economic damage from severe weather events | Inflation-adjusted direct damages (to property and crops) from natural disasters |
| Extreme Heat risk/impact | Changes in temperature and relative heat wave days |
| Access to basic needs: housing, food, clean water and clean air | Median gross rent as a percentage of household income in the past 12 months |
| Built Environment: Walkability/Bikeability | Not currently measured |
“It’s time for news organizations to think beyond just reporting. They should be part of the community, engaging and gathering feedback, and helping to build a healthier information ecosystem.”

2026 Civic Information Index Updates
Adding environmental data to the Civic Information Index has been a goal since we first launched. Natural and built environments shape our health, mobility, and ability to participate in public life. And as climate change accelerates, factors such as increasing air pollution, extreme heat, natural disasters, and wildfires threaten both physical safety and the civic infrastructure that helps communities function in the first place.
Communities whose residents are spending an outsized share of their income on energy bills, or whose crops and properties are repeatedly damaged by natural disasters, face compounding pressures that can make civic participation and equitable outcomes harder to achieve.
Working with our Advisory Board and a group of data and environment experts, we explored how to best integrate nuanced and often very geographically specific environmental data into the Index. Following the Index’s design and purpose, we wanted to stay focused on a small set of indicators so no individual indicator is crowded out in a busy field of dozens of competing and overwhelming data points. We also needed data that was available for nearly every county in the nation, and we wanted to stay committed to, wherever possible, measuring outcomes — what is actually happening in communities — rather than exposure to risk.
Measuring outcomes rather than risk
This last design feature is especially relevant in the age of climate change: A county in a hurricane-prone region or an extreme-heat corridor may still fare reasonably well if its infrastructure, economy, and systems are equipped to absorb and recover from an increase in those hazards. Conversely, a place that faces moderate climate risk on paper may fare poorly if its residents lack the resources to protect themselves when conditions worsen. This distinction mattered to us: risk and resilience do not always map onto the same places, and communities that have faced historical disinvestment are often left with little to absorb novel and increasing environmental risks.
One immediate learning from this process was that there is an urgent need for better county-level data on outcomes for key environmental risks. While data collection often exists at the local level, transparent and accessible county-by-county data sets, for example showing heat-related illness visits to emergency departments, remain elusive.
Missing indicators matter
As a result, our new environmental pillar includes two outcomes and, for now, one risk measure: (1) household energy burden (how much of their income are people spending on energy), (2) damages from natural disasters to property and crops (natural disasters here range from storms and floods to wildfires to drought), and (3) changes in temperature and relative heat wave days (as a proxy for outcome data on the impact of extreme heat). The environmental resilience pillar also includes a missing dataset: Walkability/ Bikeability was identified as a key built environment factor that impacts civic health. As with all indicators that are deemed important but where no reliable data is available, this is listed as a missing indicator.
We have also added three new indicators across existing pillars, responding to a changed environment and addressing gaps identified in the first edition of the Index.
In the News and Information pillar, we have added local journalist equivalents per 100,000 people, drawn from Muck Rack’s local journalism index. Our first edition included the Medill Local News Initiative’s well-known news deserts database showing the number of news outlets in a county. When we compared this news deserts data to the journalist equivalent data, we found that the two data sets don’t consistently correlate: some counties with multiple outlets had very few journalists, and vice versa. We added the journalist equivalent indicator to add nuance to what we know are difficult to measure realities — not just whether a newsroom exists, but whether there are people doing the reporting.
In the Civic Participation pillar, we added voter registration (as a percentage of the citizen voting age population), drawn from the U.S. Election Assistance Commission. There were several motivations to include this data set: The ongoing push to increase voting restrictions in several states stands in the way of civic participation, and is especially relevant at a time of high stake elections amidst two very different visions of America’s future. At the same time, comparing voter registration and voter turnout data shows little overlap in most counties across the nation, providing an important starting point for civic engagement and journalism teams to explore what might be at play locally.
In the Health and Opportunity pillar, we added mental health providers per 100,000 population, from County Health Rankings. Mental health is a core issue of our time: The Covid-19 pandemic has created a loneliness epidemic, the dwindling social safety net creates new stressors for millions, and an entire generation of young adults is struggling with the impact of social media and a low-opportunity job market on their wellbeing. In this environment, access to mental health care has become an important building block for civic health.